Monday, July 17, 2017

Elliott wave analysis of #NIFTY 17 July 2017

Elliott Wave Analysis for # NIFTY Cash: 9915 

As last I discuss in June 2017, Still Nifty is in a right track to reach 11000-11500…

As concluded in June 2017...Nifty reached 9900 levels..!

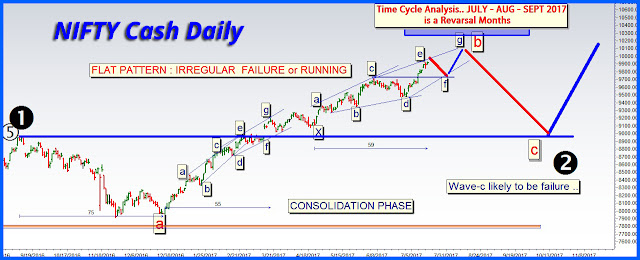
Now I discuss here my further observation about NIFTY with help of ELLIOTT WAVE ANALYSIS….Nothing major changes…minor wave-b now is in IRREGULAR FAILURE or RUNNING Correction and some modification In Diametric patterns…as current minute wave is very strong.

Both charts shows that Nifty moves in….
UP in 3rd Cycle wave
Up in 3rd primary wave
Consolidation phase in 2nd intermediate wave running…

#NIFTY analysis

NIFTY still moving Up in minor wave-b (in IRREGULAR FAILURE or RUNNING Correction) of intermediate wave -2nd.

Minor wave-b is running in a very complex wave –double combination Diametric –X- Diametric is running. Inside minor wave-b, minute wave-e of 2nd Diametric is running...

#NIFTY analysis

Conclusion: Still #NIFTY moves strongly Short term Up ….Nifty might see @ 10200-10400

As market progress i will updates the analysis...Thank You.


Friday, June 16, 2017

Elliott wave analysis for #NIFTY Cash 16 June 2017

Elliott Wave Analysis for # NIFTY Cash:9588


As last I discuss in Feb 2017, Still Nifty is in a right track  to reach 11000-11500…

Please refer https://ellwavetarget.blogspot.in/2016/02/12th-feb-2016.html

Now I discuss here my further observation about NIFTY with help of ELLIOTT WAVE ANALYSIS….
Both charts shows that Nifty moves in….
UP in 3rd Cycle wave
Up in 3rd primary wave
Consolidation  phase in 2nd intermediate wave running…

Elliott wave analysis


Still moving Up in minor wave-b(in IRREGULAR FLAT correction) of intermediate wave 2nd.
Minor wave-b is running in a very complex wave –double combination Diametric –X-Diametric is running..inside minor wave-b, minute wave-f of 2nd Diametric is running ..last minute wave-g of Diametric is still to come..which might lead Nifty to @ 9800 -9900 level.

Elliott wave analysis

Hourly chart (Not attach here)indicates that Anything close above 9620..will confirm minute wave-f  likely to be complete.. and minute wave-g will start.


Conclusion : Short term ….Nifty might seen @ 9800-9900

As market progress i will updates the analysis...Thank You.

Wednesday, February 22, 2017

Elliott Wave Analysis for # NIFTY Cash 8907

Elliott Wave Analysis for # NIFTY Cash 8907


As last I discuss in Nov 2016, about Nifty in right track to reach 11000-11500…Still we in right track to reach 11000-11500.
My projection about 11000-11500 was in Feb 2016 @ 6900..still intact.


Now I discuss here my further observation about NIFTY with help of ELLIOTT WAVE ANALYSIS….
Both charts shows that Nifty moves in….
UP in 3rd Cycle wave
Up in 3rd primary wave
Down in 2nd intermediate wave


And Up in minor wave-b(in FLAT correction) in intermediate wave 2nd.

#Nifty Elliott wave analysis

In 2nd Intermediate wave..inside Nifty moves in FLAT correction (ABC).Minor Wave-a was started downside at 8968..and ends at 7916 @ Nov 2016…than minor wave-b was started from 7916…still running.

#Nifty Elliott wave analysis

The strength of wave-b will decide the strength of wave-c downside…till wave-b retrace @ 94% of wave-a..still going up..max strength of wave-b will be @138.2% of wave-a i.e @ 9350..lets Nifty to decide how much it will go up.

I will conclude as market moves…

Monday, January 23, 2017

Elliott Wave Analysis for #DOW JONES

Elliott Wave Analysis of Dow Jones:

Monthly Chart: 
Shows that Dow Jones moves in 4th CYCLE WAVE since 2000.
Since @ 1982-83 to 2000 …It’s moved in 3rd CYCLE WAVE about 17 Years.

So minimum time frame requirements about 4TH CYCLE is 17 years... In 2017 calendar year…since 2000 till today complete the 17 years. So it’s complete minimum requirements.

# DOW JONESWeekly charts:
Shows that Inside 4Th CYCLE wave...Current PRIMARY wave D upside of Expanding triangle is running. We nearer to complete wave D... Still wave E to come downside.
So be careful about to PRIMARY wave E…Might be huge fallout.
Inside PRIMARY wave D, Double complex pattern is running .In double complex wave pattern, intermediate wave A of second pattern is running…might triangle pattern also.So conclusion is that in coming 2-3 Years consolidation phase likely. Might see @ 2000 point UP down likely….

# DOW JONES
Also as per FINANCIAL VEDIC ASTROLOGY...Saturn is moving in Sagittarius sign..
As per Vedic astrology, SATURN is always creating a DEMAND for everything.
Where JUPITER is creating a SUPPLY... So Demand is moves into a supply zone. So in coming 2 -3 years world stock Market may remain in consolidation zone … 2000 point up down may possible during 2-3 years’ time-frame.